Sharm El Sheikh Weather & Climate: Best Time to Visit
Average temperatures, rainfall, sunshine and the best time to visit Sharm El Sheikh.
Climate overview of Sharm El Sheikh
Temperatures in Sharm El Sheikh, South Sinai, Egypt, vary greatly throughout the year. August is the hottest month at 38°C (100°F), while January is the coldest at 23°C (73°F).
With just 14 mm (0.6 in) of annual rainfall, the city has a dry, desert-like climate. July is the sunniest month, averaging 13.4 hours of sunshine per day.
Sharm El Sheikh Weather by Month
Pick a month to see the average temperature, rainfall and sunshine in Sharm El Sheikh — and find the best time to visit.
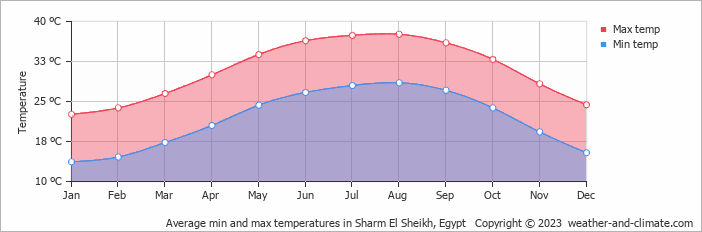
Monthly Temperature in Sharm El Sheikh
The climate in Sharm El Sheikh is known for significant temperature differences throughout the year, making the weather dynamic. Average daytime temperatures reach a very hot 38°C (100°F) in August. In January, the coolest month of the year, temperatures drop to a comfortable 23°C (73°F).
At night, temperatures range from around 29°C (84°F) in August to 14°C (57°F) in January.
Check out our detailed temperature page for more information.
Temperature ranges by month
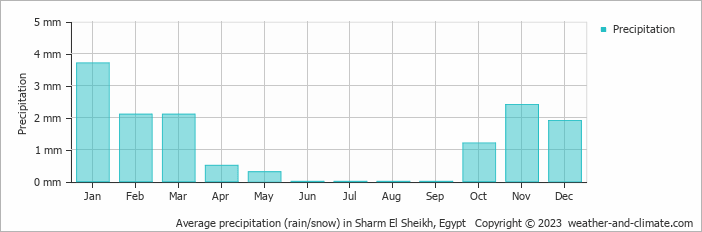
Rainfall in Sharm El Sheikh
Sharm El Sheikh is known for its low rainfall, with yearly precipitation amounts around 14 mm (0.6 in). Despite minor fluctuations, Sharm El Sheikh enjoys fairly consistent precipitation throughout the year. In January, you can expect around 3.7 mm (0.1 in) of precipitation, while in June, Sharm El Sheikh receives about 0 mm (0 in). For more details, please visit our Sharm El Sheikh Precipitation page.
The mean monthly precipitation over the year, including rain, hail, and snow
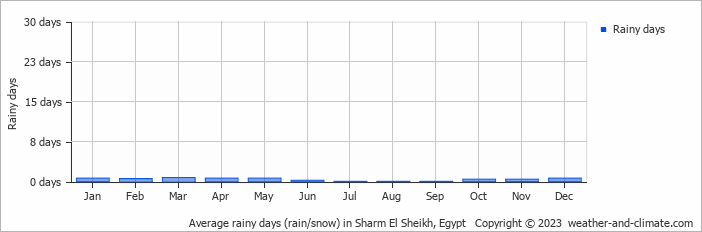
The average number of days each month with precipitation
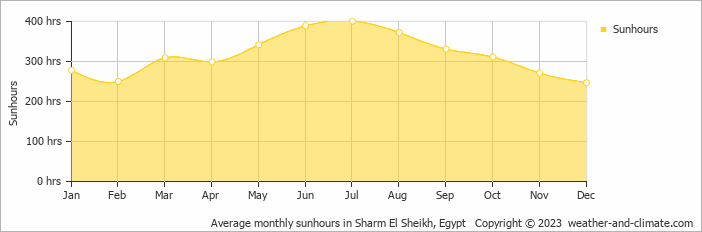
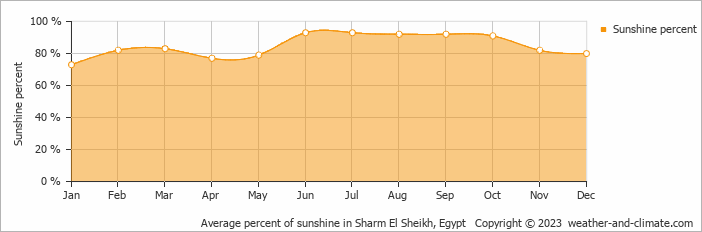
Sunshine Hours in Sharm El Sheikh
Sharm El Sheikh experiences moderate variation in sunshine hours across the seasons. With 13.4 hours daily sunshine in July, it dips to 8.2 hours in December, offering a balanced mix of sunny and overcast days.
Visit our detailed sunshine hours page for more information.
Monthly hours of sunshine
Daily hours of sunshine
Daily percentage of sunshine
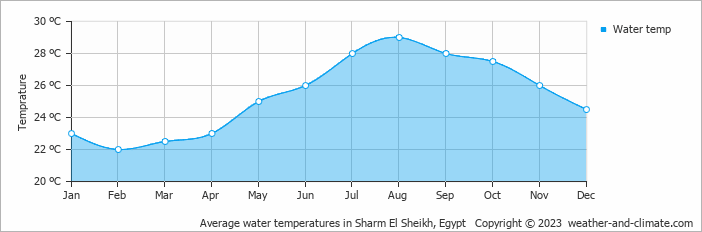
Water Temperature in Sharm El Sheikh
The mean water temperature over the year ranges from 22°C (72°F) in February to 29°C (84°F) in August.
Water temperature over the year
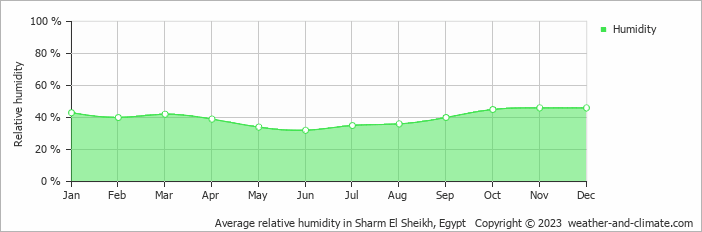
Humidity in Sharm El Sheikh by Month
The relative humidity is low throughout the year in Sharm El Sheikh.
The city experiences its highest humidity in November, reaching 46%. In June, the humidity drops to its lowest level at 32%. What does this mean? Read our detailed page on humidity levels for further details.
Relative humidity over the year
Best Time to Visit Sharm El Sheikh
Pack accordingly for the dry conditions. Sun protection and a hat are essential, though rain gear is rarely needed. Wondering where to travel based on your weather preferences? Our recommendation tool helps you find destinations with your ideal climate conditions. Use our weather planner to find your perfect destination.
Frequently asked questions about the climate in Sharm El Sheikh
What is the best time to visit Sharm El Sheikh?
January, February, March, November and December typically offer the most optimal weather in Sharm El Sheikh. In contrast, May, June, July, August and September tend to have less optimal conditions. Sharm El Sheikh has a distinct dry season from January to December.
What temperatures can I expect in Sharm El Sheikh?
Daytime highs range from 23°C (73°F) in January to 38°C (100°F) in August. Nighttime lows range from 14°C (57°F) to 29°C (84°F). Temperatures vary considerably through the year.
How much rain does Sharm El Sheikh get?
Annual rainfall is around 14 mm (0.6 in). January is the wettest month with 3.7 mm (0.1 in), while June is the driest with 0 mm (0 in).
How sunny is Sharm El Sheikh?
Sharm El Sheikh receives around 3,800 hours of sunshine per year. July is the sunniest month with 401 hours, while December is the cloudiest with just 247 hours. Overall, Sharm El Sheikh enjoys abundant sunshine.
Sharm El Sheikh 3-Day Forecast
Sharm El Sheikh 3-Day Forecast
Sharm El Sheikh on the map
Sharm El Sheikh is highlighted — select any city to see its climate.
Popular this month
Where to go in July — average daytime high across popular destinations.
Bucket list
Need travel inspiration? Check out our bucket list articles and be inspired.
 The Pyramids of Giza are impressive and absolutely worth a visit
The pyramids are considered to be one of the seven wonders of the world in ancient times and they are the only one that still exist and can be visited today.
The Sinai Peninsula: Nowhere on earth is as quiet as this place
The Sinai Peninsula has an extraordinary and enchanting landscape. The peace and space in this region is overwhelming. Nowhere on earth is as quiet as this place.
The Timeless Wonders of Luxor
Discover Luxor’s ancient marvels, from the grand Karnak temple and royal tombs of Thebes to the historic charm of the Old Winter Palace.