Al Wakrah Weather & Climate: Best Time to Visit
Average temperatures, rainfall, sunshine and the best time to visit Al Wakrah.
Climate overview of Al Wakrah
For the Football World Cup to be organized in 2022, it means that measures must be taken to ensure that it is not too hot for footballers, supervisors and supporters. To combat the enormous heat, it is highly likely that cooling installations with a very high capacity will be installed in stadiums, on training complexes and in places where fans come together.
Al Wakrah Weather by Month
Pick a month to see the average temperature, rainfall and sunshine in Al Wakrah — and find the best time to visit.

Monthly Temperature in Al Wakrah
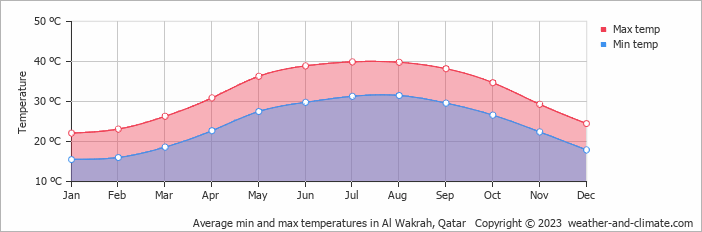
In Al Wakrah, temperatures differ significantly between summer and winter months. On average, daytime temperatures range from a very hot 40°C (104°F) in July to a comfortable 22°C (72°F) in January.
Nighttime temperatures range from 32°C (90°F) in July to 16°C (61°F) in January.
Check out our detailed temperature page for more information.
Temperature ranges by month
Rainfall in Al Wakrah
Al Wakrah sits in an arid zone with minimal moisture, averaging 62 mm (2.4 in) of rainfall per year. The wettest period in Al Wakrah occurs in December, which receives around 14 mm (0.6 in) of precipitation. During the driest month, June, Al Wakrah experiences almost no rainfall, totaling 0 mm (0 in). The consistent precipitation levels throughout the year contribute to a relatively stable climate. For more details, please visit our Al Wakrah Precipitation page.
The mean monthly precipitation over the year, including rain, hail, and snow

The average number of days each month with precipitation

Sunshine Hours in Al Wakrah
Al Wakrah enjoys sunny spells year-round. June sees up to 11.4 hours of daily sunshine, perfect for a sunny trip. February, the least sunny month, still offers a generous 7.5 hours of sun despite this cloudier time of the year.
Visit our detailed sunshine hours page for more information.
Monthly hours of sunshine

Daily hours of sunshine
Humidity in Al Wakrah by Month
The relative humidity is moderate throughout the year in Al Wakrah.
The city experiences its highest humidity in January, reaching 71%. In June, the humidity drops to its lowest level at 42%. What does this mean? Read our detailed page on humidity levels for further details.
Relative humidity over the year

Wind Speed in Al Wakrah
The mean wind speed over the year ranges from 3 m/s (6 knots) in September and October to 5 m/s (10 knots) in May and June. What does this mean?
The mean monthly wind speed over the year (meters per second)

Best Time to Visit Al Wakrah
While rain is rare, remember to stay hydrated and protect yourself from the sun while you're outside. Looking for inspiration on where to travel this year? We have a tool that recommends destinations based on your ideal conditions. Find out where to go with our weather planner.
Frequently asked questions about the climate in Al Wakrah
What is the best time to visit Al Wakrah?
January, February, March, November and December typically offer the most optimal weather in Al Wakrah. In contrast, May, June, July, August, September and October tend to have less optimal conditions. Al Wakrah has a distinct dry season from January to December.
What temperatures can I expect in Al Wakrah?
Daytime highs range from 22°C (72°F) in January to 40°C (104°F) in July. Nighttime lows range from 16°C (61°F) to 32°C (90°F). Temperatures vary considerably through the year.
How much rain does Al Wakrah get?
Annual rainfall is around 62 mm (2.4 in). December is the wettest month with 14 mm (0.6 in), while June is the driest with 0 mm (0 in).
How sunny is Al Wakrah?
Al Wakrah receives around 3,435 hours of sunshine per year. June is the sunniest month with 342 hours, while February is the cloudiest with just 224 hours. Overall, Al Wakrah enjoys abundant sunshine.
Al Wakrah 3-Day Forecast
Al Wakrah 3-Day Forecast
Al Wakrah on the map
Al Wakrah is highlighted — select any city to see its climate.
Popular this month
Where to go in July — average daytime high across popular destinations.
 Doha
Doha 41°C (106°F) Al-Rayyan41°C (106°F) Mesaieed41°C (106°F) Ad Dawhah41°C (106°F) Al Wakrah40°C (104°F) Lusail39°C (102°F) Al Khor38°C (100°F)


