Quibdó Weather & Climate: Best Time to Visit
Average temperatures, rainfall, sunshine and the best time to visit Quibdó.
Climate overview of Quibdó
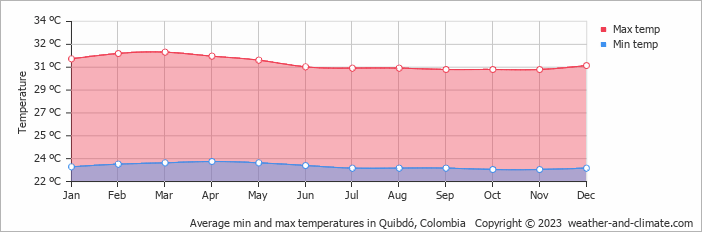
With consistently stable weather, Quibdó, Choco, Colombia, sees little seasonal temperature change. Daytime highs average 31°C (88°F), ranging from 32°C (90°F) in March to 30°C (86°F) in October.
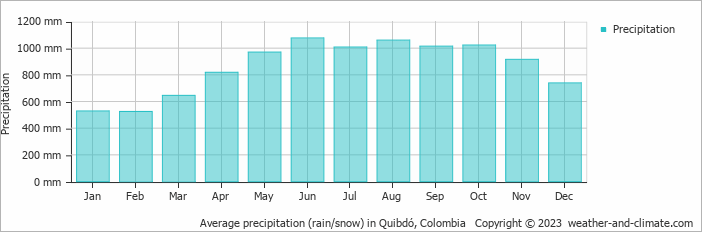
Rainfall is high, totalling around 10317 mm (406 in) per year. June is the wettest month and February the driest. The most sunshine falls in July, with an average of 4.6 hours of daily sunshine.
Quibdó Weather by Month
Pick a month to see the average temperature, rainfall and sunshine in Quibdó — and find the best time to visit.
Monthly Temperature in Quibdó
The climate in Quibdó remains fairly constant, offering very warm temperatures throughout the year. Average maximum daytime temperatures range from a very warm 32°C (90°F) in March, the warmest time of the year, to a very warm 30°C (86°F) during cooler months like October.
At night, you can expect temperatures ranging from 24°C (75°F) in March to around 23°C (73°F) during October.
Check out our detailed temperature page for more information.
Temperature ranges by month
Rainfall in Quibdó
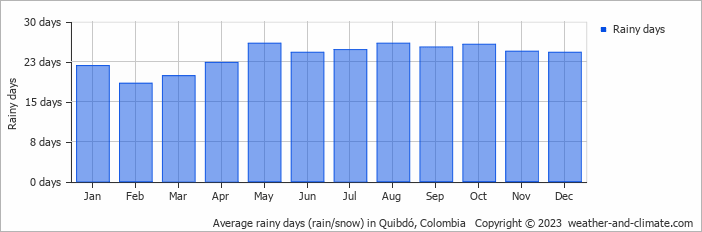
Quibdó is known for its substantial rainfall, with annual precipitation reaching 10317 mm (406 in). While rainfall varies throughout the year, each season offers its own charm. June brings wetter days averaging 1076 mm (42 in) of precipitation, spread over 24 rainy days.
In contrast, the driest month February experiences a drier climate, with about 524 mm (21 in) of rainfall spread across 18 rainy days. For more details, please visit our Quibdó Precipitation page.
The mean monthly precipitation over the year, including rain, hail, and snow
The average number of days each month with precipitation
Sunshine Hours in Quibdó
While the amount of sunshine in Quibdó varies throughout the year, all seasons offer their own charm. Enjoy up to 4.6 hours of daily sun in July, and experience slightly darker atmosphere in February, with about 2.8 hours of daily sunlight.
Visit our detailed sunshine hours page for more information.
Monthly hours of sunshine
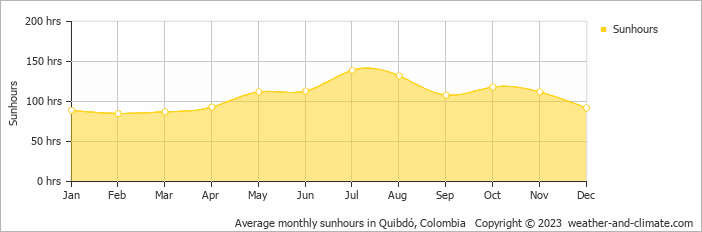
Daily hours of sunshine
Humidity in Quibdó by Month
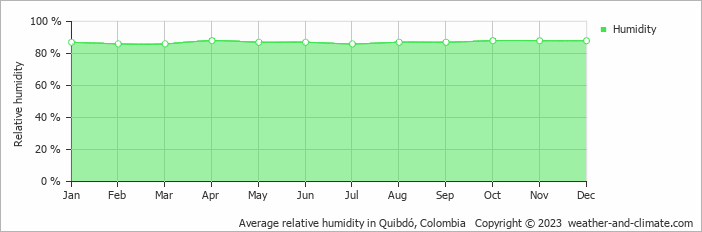
The city experiences its highest humidity in April, reaching 88%. In February, the humidity drops to its lowest level at 86%. What does this mean? Read our detailed page on humidity levels for further details.
Relative humidity over the year
Best Time to Visit Quibdó
Embrace the wet climate by bringing proper rain gear and plan activities that are indoor. Need help choosing your next travel destination? We offer a specialized tool that matches you with locations based on your weather preferences. Explore destinations that suit your climate preferences.
Frequently asked questions about the climate in Quibdó
What temperatures can I expect in Quibdó?
Daytime highs range from 30°C (86°F) in October to 32°C (90°F) in March. Nighttime lows range from 23°C (73°F) to 24°C (75°F). Temperatures stay relatively stable year-round.
How much rain does Quibdó get?
Annual rainfall is around 10317 mm (406 in). June is the wettest month with 1076 mm (42 in), while February is the driest with 524 mm (21 in).
How sunny is Quibdó?
Quibdó receives around 1,280 hours of sunshine per year. July is the sunniest month with 139 hours, while February is the cloudiest with just 85 hours.
Quibdó 3-Day Forecast
Quibdó 3-Day Forecast
Quibdó on the map
Quibdó is highlighted — select any city to see its climate.
Popular this month
Where to go in July — average daytime high across popular destinations.
 Cartagena
 31°C (88°F) Santa Marta29°C (84°F) San Andrés29°C (84°F) Cali
 28°C (82°F) Medellín26°C (79°F) Pereira24°C (75°F) Bogotá21°C (70°F) Villa de Leyva
 20°C (68°F)


Bucket list
Need travel inspiration? Check out our bucket list articles and be inspired.
 The 10 most alternative cities in South America
Discover South America's top 10 alternative cities! From Valparaíso's vibrant streets to La Paz's high-altitude charm and Medellín's innovative spirit.
5 Hidden Gems in Colombia
Explore Colombia's hidden gems, from El Cocuy's remote beauty to Providencia's serene beaches, offering authentic experiences off the beaten path.
Tayrona National Park: the most beautiful part of Colombia
Visit the park between the months December and March (not February since it is closed) or from June till August (this is high season).
Breathtaking view in Minca
Minca is a tiny village in the tropical rain forest of Colombia and is an oasis of tranquility. Everyone looking for a relatively undiscovered piece of Colombia is in the right place here.