Kuqa Weather & Climate: Best Time to Visit
Average temperatures, rainfall, sunshine and the best time to visit Kuqa.
Climate overview of Kuqa
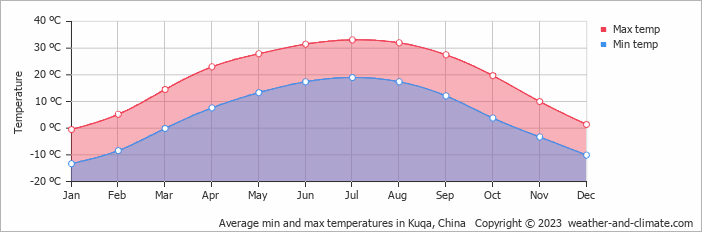
The climate in Kuqa, China, is marked by large temperature swings across the seasons, ranging from 33°C (91°F) in July to -1°C (30°F) in January.
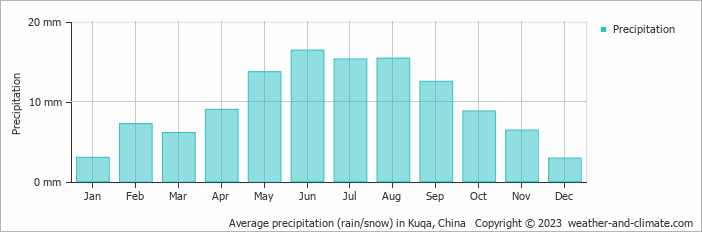
Rain/snowfall is extremely rare, with only 117 mm (4.6 in) falling across the entire year.
Kuqa Weather by Month
Pick a month to see the average temperature, rainfall and sunshine in Kuqa — and find the best time to visit.
Monthly Temperature in Kuqa
In Kuqa, temperatures differ significantly between summer and winter months. Average maximum daytime temperatures range from a very warm 33°C (91°F) in July, the warmest time of the year, to a very cold -1°C (30°F) during cooler months like January.
At night, you can expect temperatures ranging from 19°C (66°F) in July to around -13°C (9°F) during January.
Check out our detailed temperature page for more information.
Temperature ranges by month
Rainfall in Kuqa
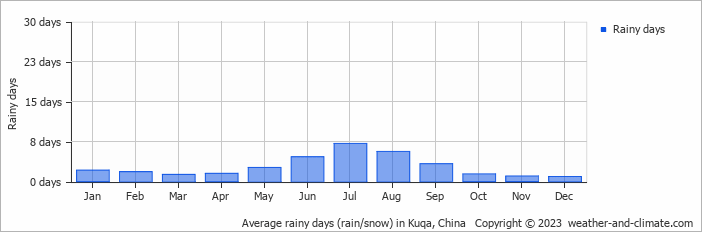
Kuqa sits in an arid zone with minimal moisture, averaging 117 mm (4.6 in) of rain/snowfall per year. Significant seasonal changes in precipitation occur throughout the year. In the wettest month, June it receives low rainfall, averaging 16 mm (0.6 in) of precipitation, recorded across 5 rainy days. In contrast, the driest month December brings less snowfall, with 2.9 mm (0.1 in) over a single snowy day. For more details, please visit our Kuqa Precipitation page.
The mean monthly precipitation over the year, including rain, hail, and snow
The average number of days each month with precipitation
Best Time to Visit Kuqa
While rain is rare, remember to stay hydrated and protect yourself from the sun while you're outside. Need help choosing your next travel destination? We offer a specialized tool that matches you with locations based on your weather preferences. Explore destinations that suit your climate preferences.
Frequently asked questions about the climate in Kuqa
What is the best time to visit Kuqa?
April, May, September and October typically offer the most optimal weather in Kuqa. In contrast, January and December tend to have less optimal conditions. Kuqa has a distinct dry season from January to December.
What temperatures can I expect in Kuqa?
Daytime highs range from -1°C (30°F) in January to 33°C (91°F) in July. Nighttime lows range from -13°C (9°F) to 19°C (66°F). Temperatures vary considerably through the year.
How much rain does Kuqa get?
Annual rainfall is around 117 mm (4.6 in). June is the wettest month with 16 mm (0.6 in), while December is the driest with 2.9 mm (0.1 in).
Kuqa 3-Day Forecast
Kuqa 3-Day Forecast
Kuqa on the map
Kuqa is highlighted — select any city to see its climate.
Popular this month
Where to go in July — average daytime high across popular destinations.
Bucket list
Need travel inspiration? Check out our bucket list articles and be inspired.
 The Li River: A Journey Through China’s Most Breathtaking Landscape
Explore the Li River, China's breathtaking landscape with majestic mountains, serene waters, and picturesque views. A must-see for every traveler.
Go to China's Zhangjiajie National Park with the highest, the fastest, largest-loaded outdoor elevator in the world
You won't find this unique landscape anywhere else in the world. Thousands of floating mountains overgrown with trees at the top dominate this fairy tale landscape.
Go to Xinjiang in China
In Xinjiang you get to see a mix of East and Central Asia. An experience that you might want to add to your bucket list. You can travel through the province as if you are following an ancient silk route.
Mount Kailash
The best time for a Kailash tour/trekking is from mid-May to mid-October when the temperature is most pleasant. It is warm, dry and sunny in that period.