Kermadec Weather & Climate: Best Time to Visit
Average temperatures, rainfall, sunshine and the best time to visit Kermadec.
Climate overview of Kermadec
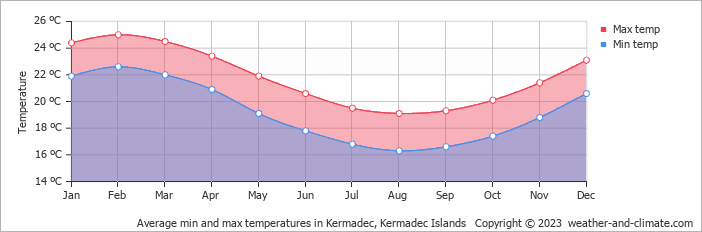
Kermadec, Kermadec Islands, has a stable climate with little temperature variation across the year. Average daytime temperatures hover around 22°C (72°F), peaking in February at 25°C (77°F) and dipping in August to 19°C (66°F).
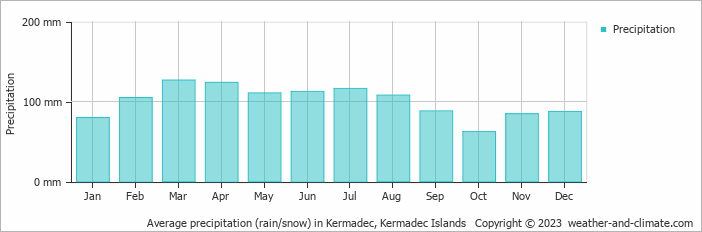
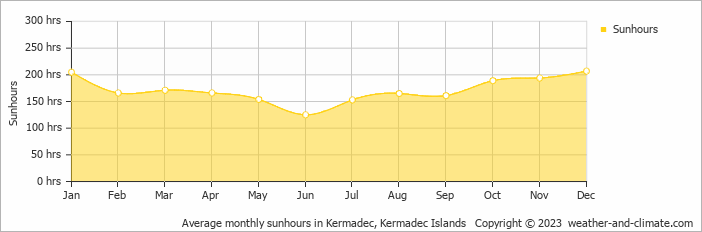
The city receives considerable rainfall, with around 1204 mm (47 in) annually. March is the wettest month. December is the sunniest month, averaging 6.9 hours of sunshine per day.
Kermadec Weather by Month
Pick a month to see the average temperature, rainfall and sunshine in Kermadec — and find the best time to visit.


Monthly Temperature in Kermadec
With minimal seasonal shifts, Kermadec experiences a constant climate year-round. Typically, average maximum daytime temperatures range from a comfortable 25°C (77°F) in February to a pleasant 19°C (66°F) in the coolest month, August.
Nights vary from 23°C (73°F) in February to around 16°C (61°F) during the colder months.
Check out our detailed temperature page for more information.
Temperature ranges by month
Rainfall in Kermadec
Kermadec has a notably wet climate with abundant precipitation, recording 1204 mm (47 in) of rainfall per year. Kermadec offers a pleasant mix of wetter and slightly drier months. The difference in precipitation between the wettest month March (127 mm (5 in)) and the driest month October (62 mm (2.4 in)) is not too significant. For more details, please visit our Kermadec Precipitation page.
The mean monthly precipitation over the year, including rain, hail, and snow
The average number of days each month with precipitation

Sunshine Hours in Kermadec
For those who appreciate different seasons, Kermadec serves as an ideal destination. Expect longer, more sun-filled days in December with an average of 6.9 hours of sunshine daily, and embrace the darker days in June, offering only 4.2 hours of daily sunlight.
Visit our detailed sunshine hours page for more information.
Monthly hours of sunshine
Daily hours of sunshine
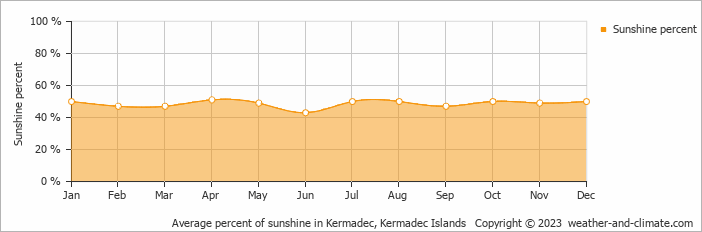
Daily percentage of sunshine
Water Temperature in Kermadec
The mean water temperature over the year ranges from 17°C (63°F) in August to 22°C (72°F) in January.
Water temperature over the year

Humidity in Kermadec by Month
The city experiences its highest humidity in February, reaching 85%. In May, the humidity drops to its lowest level at 80%. What does this mean? Read our detailed page on humidity levels for further details.
Relative humidity over the year

Best Time to Visit Kermadec
The varied rainfall (from 62 mm (2.4 in) to 127 mm (5 in)) creates diverse landscapes throughout the year. For the best outdoor conditions, plan your visit during the drier months like October. Wondering where to travel based on your weather preferences? Our recommendation tool helps you find destinations with your ideal climate conditions. Use our weather planner to find your perfect destination.
Frequently asked questions about the climate in Kermadec
What is the best time to visit Kermadec?
January, October, November and December typically offer the most optimal weather in Kermadec. In contrast, August tends to have less optimal conditions.
What temperatures can I expect in Kermadec?
Daytime highs range from 19°C (66°F) in August to 25°C (77°F) in February. Nighttime lows range from 16°C (61°F) to 23°C (73°F). Temperatures stay relatively stable year-round.
How much rain does Kermadec get?
Annual rainfall is around 1204 mm (47 in). March is the wettest month with 127 mm (5 in), while October is the driest with 62 mm (2.4 in).
How sunny is Kermadec?
Kermadec receives around 2,056 hours of sunshine per year. December is the sunniest month with 207 hours, while June is the cloudiest with just 125 hours. Overall, Kermadec enjoys abundant sunshine.
Kermadec 3-Day Forecast
Kermadec 3-Day Forecast
Kermadec on the map
Kermadec is highlighted — select any city to see its climate.
Popular this month
Where to go in July — average daytime high across popular destinations.


