

Prince Rupert (BC) Temperature by Month
Prince Rupert, British Columbia, Canada has an average annual maximum temperature of 11°C (52°F), ranging from 5°C (41°F) in January to 17°C (63°F) in August. Below you'll find a full monthly breakdown and a comparison with cities worldwide.
Prince Rupert Monthly Temperatures
With significant temperature fluctuations, Prince Rupert enjoys distinct seasons year-round. Nighttime lows range from 12°C (54°F) in August to 0°C (32°F) in January.
The chart below illustrates the average maximum day and minimum night temperatures in Prince Rupert by month:
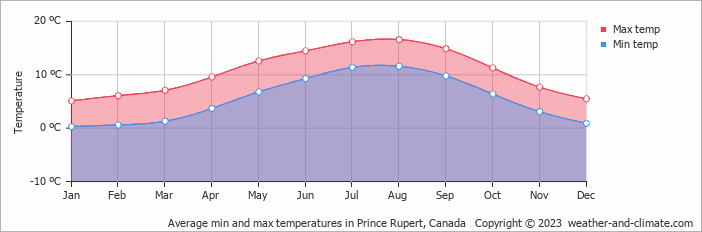
The coolest part of the day is typically between 4 AM and 6 AM, while 3 PM is usually the warmest, when solar heating is at its peak. August, the city's warmest month, averages 142 hours of sunshine.
The chart below shows the average temperature throughout the year:
Daily Historical Temperatures
50-year average (1976-2025)
Average high and low temperatures for each day of the month based on long-term records.
Average temperatures in July
Historical Prince Rupert Temperatures: 1976-2026
Browse day-by-day temperature records for Prince Rupert spanning 51 years. Select any month and year to see actual high and low temperatures recorded on each day.
Temperature: Prince Rupert vs Canada
The map below shows the annual temperature across Canada. You can also select individual months if you want to compare a specific time of year.
 very warm
 warm
warm
 pleasant
 moderate
 cold
cold
 very cold
Prince Rupert vs World: Temperature Compared
Prince Rupert's average annual maximum temperature is 11°C (52°F). To put that in context, here's how it compares to a few well-known destinations:
Rome, Italy averages 20°C (68°F) annually, with reliably warm summers and comfortable winters.
On the cooler end, Oslo, Norway averages just 10°C (50°F) annually, with pleasant summers but long, cold winters.
San Francisco, USA averages 19°C (66°F) annually, but with little seasonal variation — summers are often cool and foggy, winters mild.
Tokyo, Japan averages 21°C (70°F) a year, with hot summers, cool winters, and a well-defined cherry blossom spring.
What Does the Temperature Feel Like in Prince Rupert?
Temperature alone doesn't tell the whole story — humidity plays a big role in how warm or cold it actually feels. High humidity in summer makes the heat feel more intense, particularly once temperatures climb above 25°C. In winter, the same humidity can make cold air feel sharper than the thermometer suggests.
In the cooler months, when temperatures drop below 10°C, high humidity makes the cold feel more cutting than it would in dry conditions.
In Prince Rupert, January is the coolest month, with average highs of 5°C (41°F) and humidity around 85% — considered very high. For a full picture, see our humidity page.
Climate temperature data is typically calculated as a 30-year average. This smooths out year-to-year variability and gives a more reliable picture of what a place is actually like, rather than what happened in any single unusual year.
The readings come from a range of sources — land-based weather stations, ocean buoys, ships, and satellites. That data is collected by weather services around the world, then pooled, quality-checked, and averaged to produce the climate records you see here.
For cities and regions with significant elevation, altitude is one of the biggest factors shaping local temperatures. As a rule of thumb, temperatures fall by around 6°C for every 1,000 metres gained — so a city at 2,000 metres will typically be around 12°C cooler than a city at sea level in the same region. Higher ground also tends to see more dramatic day-to-night temperature swings, since thinner air loses heat faster after sunset.
For more on Prince Rupert's weather — including monthly rainfall, sunshine hours, and humidity — visit our Prince Rupert climate page.


