

Arica Sunshine Hours by Month
Sunshine is key to understanding how a place experiences its seasons. This page shows the total number of hours of direct sunlight per month and the average hours per day in Arica, Arica y Parinacota, Chile. This average is based on long-term data collected between 1990 and 2020.
Monthly hours of sunshine
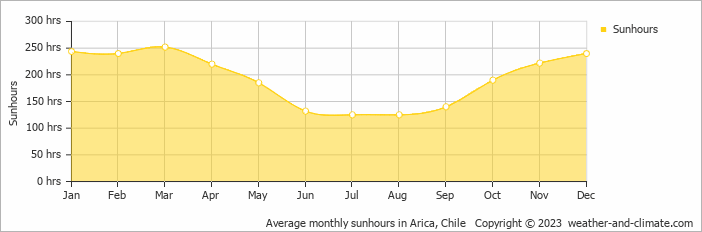
If you're visiting Arica, timing is key. In March, you can enjoy up to 252 hours of sunshine, while the shorter days of August provide just 125 hours. The total annual amount of sun is 2315 hours.
Daily hours of sunshine
Seasonal changes in sunshine hours are quite obvious in Arica. While March receives considerable daily sunshine with up to 8.4 hours, July marks the darkest time of the year, where sunshine is scarce with only 4.2 hours of sunlight per day.
Arica vs Major Cities: Sunshine Compared
Arica enjoys an average of 2315 hours of sunshine annually. Let’s compare this with some popular tourist destinations:
Seville, Spain, enjoys an impressive 2920 hours of sunshine per year, making it an ideal destination even in winter.
In contrast, Reykjavík, Iceland, receives only about 1330 hours of sunshine per year, known for its frequently overcast and rainy skies.
Oslo, Norway, receives approximately 1690 hours of sunshine annually.
Adelaide, Australia, enjoys 2770 hours of sunshine annually, with long, sunny summers.
Related Climate Data for Arica
June, Arica’s wettest month, receives 18 mm (0.7 in) of rainfall and has a maximum daytime temperature of 21°C (70°F). During the driest month December you can expect a temperature of 25°C (77°F).
For more detailed insights into the city’s temperatures, check out our Temperature page. To explore more about precipitation patterns, visit our Arica Precipitation page.


