Average monthly rainy days in Salvador
The number of days each month with rain, snow and hail in Salvador (Bahia), Brazil.
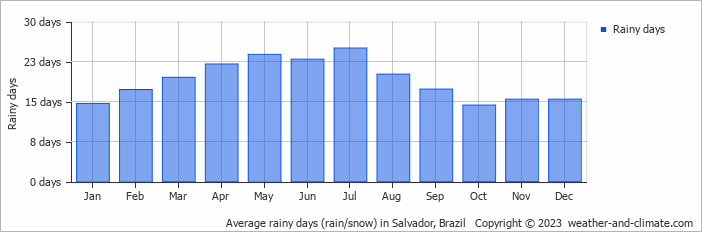
- Most rainy days are in February, March, April, May, June, July, August, September, November and December.
- On average, July is the most rainy with 25 days of rain/snow.
- On average, October is the driest month with 14 rainy days.
- The average annual number of rainy days is 227.
Weather Forecasts for Salvador
Tue Apr 23
27°C | 24°C
SW  25 km/h
25 km/h1.8 mm
broken clouds and slight rain
Wed Apr 24
28°C | 24°C
SE 18 km/h
18 km/h11 mm
partly cloudy and rain
Thu Apr 25
28°C | 25°C
SE 18 km/h
18 km/h4.6 mm
partly cloudy and rain


