Valentia Weather & Climate: Best Time to Visit
Average temperatures, rainfall, sunshine and the best time to visit Valentia.
Climate overview of Valentia
The climate in Valentia, Ireland, sees a moderate range of temperatures across the year, from 18°C (64°F) in August down to 10°C (50°F) in February.
The city has a wet climate, receiving around 1553 mm (61 in) of rainfall per year. December is the wettest month. Sunshine peaks in May, when the city sees around 6.0 hours of sunshine per day.
Valentia Weather by Month
Pick a month to see the average temperature, rainfall and sunshine in Valentia — and find the best time to visit.
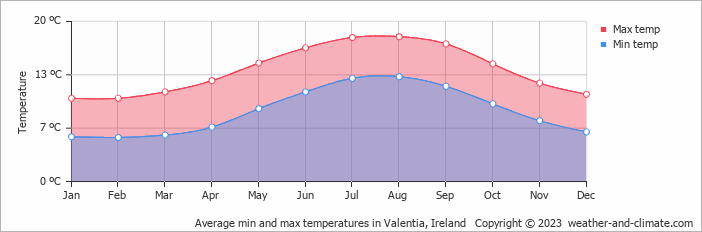
Monthly Temperature in Valentia
The climate in Valentia experiences moderate temperature changes, with mild shifts between seasons. On average, daytime temperatures range from a pleasant 18°C (64°F) in August to a chilly 10°C (50°F) in February.
Nighttime temperatures range from 13°C (55°F) in August to 6°C (43°F) in February.
Check out our detailed temperature page for more information.
Temperature ranges by month
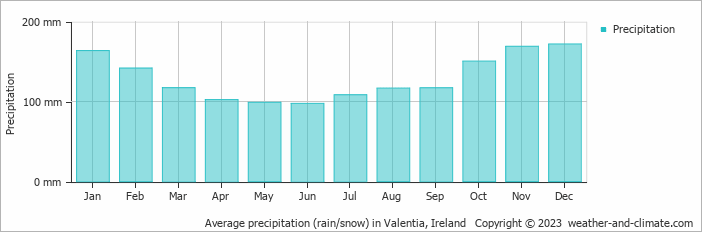
Rainfall in Valentia
Valentia experiences significant rainfall throughout the year, averaging 1553 mm (61 in) of precipitation annually. The amount of precipitation varies moderately throughout the year. The wettest month, December, sees around 172 mm (6.8 in) of rainfall, perfect for those who enjoy a bit of rain now and then. The driest month, June, still receives a respectable 97 mm (3.8 in) of rainfall. For more details, please visit our Valentia Precipitation page.
The mean monthly precipitation over the year, including rain, hail, and snow
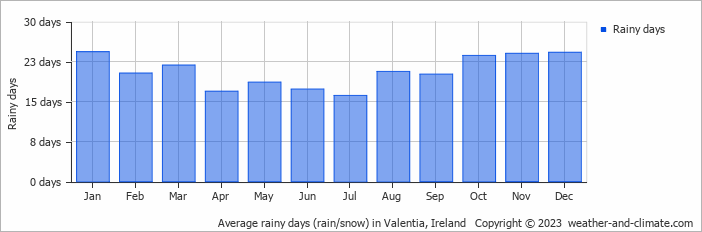
The average number of days each month with precipitation
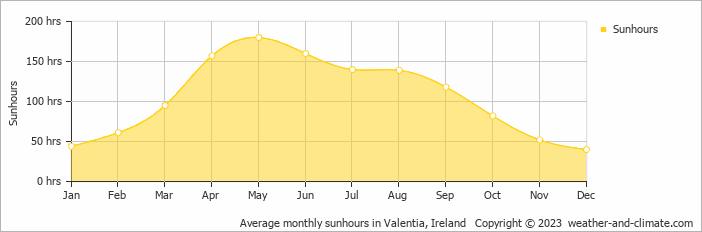
Sunshine Hours in Valentia
In Valentia, summer days are longer and more sunny, with daily sunshine hours peaking at 6.0 hours in May. As the darker season arrives, the brightness of the sun becomes less. December sees a soft sun for only 1.3 hours per average day.
Visit our detailed sunshine hours page for more information.
Monthly hours of sunshine
Daily hours of sunshine
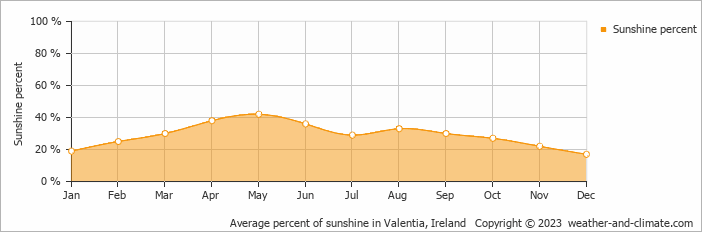
Daily percentage of sunshine
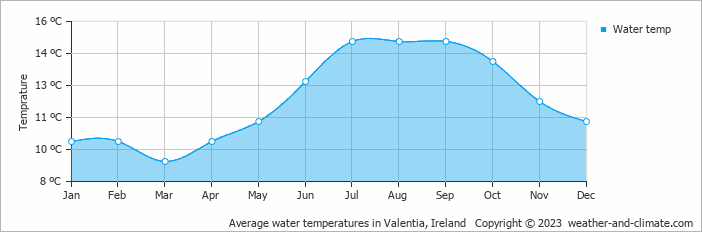
Water Temperature in Valentia
The mean water temperature over the year ranges from 9°C (48°F) in March to 15°C (59°F) in July.
Water temperature over the year
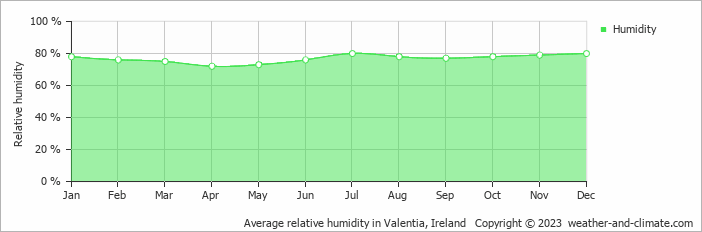
Humidity in Valentia by Month
The relative humidity is high throughout the year in Valentia.
The city experiences its highest humidity in July, reaching 80%. In April, the humidity drops to its lowest level at 72%. What does this mean? Read our detailed page on humidity levels for further details.
Relative humidity over the year
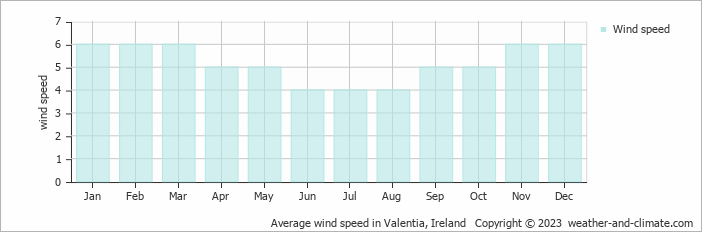
Wind Speed in Valentia
The mean wind speed over the year ranges from 4 m/s (8 knots) in June, July and August to 6 m/s (12 knots) in January, February, March, November and December. What does this mean?
The mean monthly wind speed over the year (meters per second)
Best Time to Visit Valentia
Be prepared for heavier rainfall during January, November and December, the wettest period of the year. Seeking the perfect travel destination for this year? We've created a tool that suggests locations matching your desired weather. Let our weather planner guide your travel decisions.
Frequently asked questions about the climate in Valentia
What is the best time to visit Valentia?
May, June, July and August typically offer the most optimal weather in Valentia. In contrast, January, February, March, April, November and December tend to have less optimal conditions.
What temperatures can I expect in Valentia?
Daytime highs range from 10°C (50°F) in February to 18°C (64°F) in August. Nighttime lows range from 6°C (43°F) to 13°C (55°F).
How much rain does Valentia get?
Annual rainfall is around 1553 mm (61 in). December is the wettest month with 172 mm (6.8 in), while June is the driest with 97 mm (3.8 in).
How sunny is Valentia?
Valentia receives around 1,268 hours of sunshine per year. May is the sunniest month with 180 hours, while December is the cloudiest with just 40 hours.
Valentia 3-Day Forecast
Valentia 3-Day Forecast
Valentia on the map
Valentia is highlighted — select any city to see its climate.
Popular this month
Where to go in July — average daytime high across popular destinations.
Bucket list
Need travel inspiration? Check out our bucket list articles and be inspired.
 Go to Dingle in Ireland
Dolphins, Whales and breathtaking views. The colorful fishing village Dingle in Ireland has it all and this town is a must for your bucket list.
An Irish adventure like no other in Killarney National Park
Head down to the South West part of the country, County Kerry, to the small town of Killarney. If you want to experience what Ireland is really all about
Horseback riding in Ireland
Ireland is the most ideal place in the world for horseback riding. Combine this with the most hospitable people you will ever encounter and you have an unforgettable dream trip to add to your bucket list.