Samara Weather & Climate: Best Time to Visit
Average temperatures, rainfall, sunshine and the best time to visit Samara.
Climate overview of Samara
Temperatures in Samara, Samara Region, Russia, vary greatly throughout the year. July is the hottest month at 28°C (82°F), while February is the coldest at -6°C (21°F).
With around 548 mm (22 in) of annual rain/snowfall, the city has moderate precipitation levels. June is the wettest month and March the driest. It also has a distinct dry season from February to March. July is the sunniest month, averaging 10.4 hours of sunshine per day.
Samara Weather by Month
Pick a month to see the average temperature, rainfall and sunshine in Samara — and find the best time to visit.
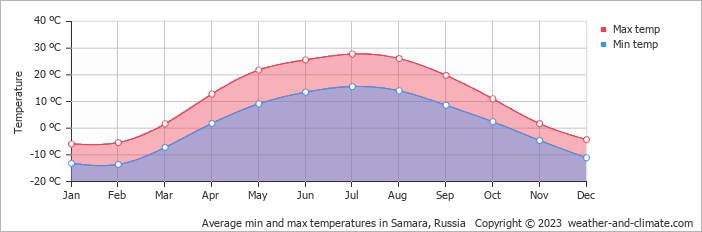
Monthly Temperature in Samara
The climate in Samara is known for significant temperature differences throughout the year, making the weather dynamic. Typically, average maximum daytime temperatures range from a comfortable 28°C (82°F) in July to a very cold -6°C (21°F) in the coolest month, February.
Nights vary from 16°C (61°F) in July to around -14°C (7°F) during the colder months.
Check out our detailed temperature page for more information.
Temperature ranges by month
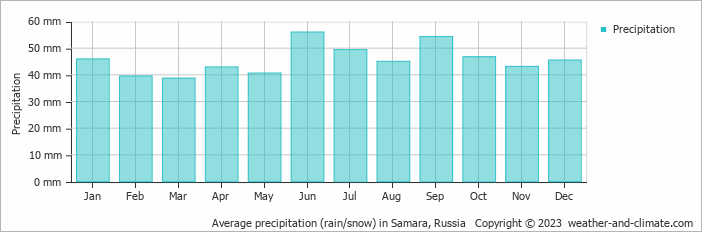
Rainfall in Samara
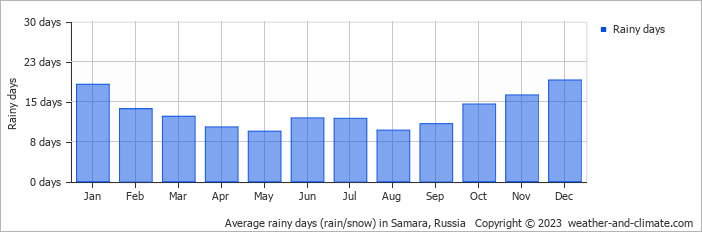
Generally, Samara receives mid-range precipitation levels, with 548 mm (22 in) annually. Precipitation levels in Samara remain relatively steady throughout the year. June has the most rain, with 56 mm (2.2 in) over 12 days. In the driest month March, this drops slightly to 39 mm (1.5 in), making the city's climate fairly predictable. For more details, please visit our Samara Precipitation page.
The mean monthly precipitation over the year, including rain, hail, and snow
The average number of days each month with precipitation
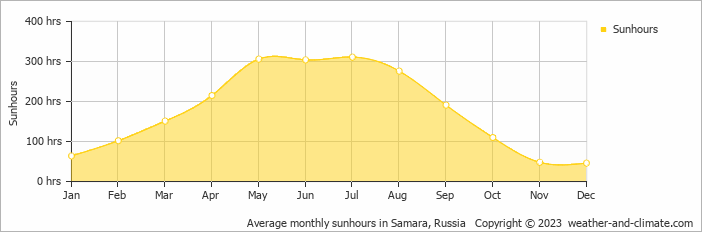
Sunshine Hours in Samara
For those who appreciate different seasons, Samara serves as an ideal destination. Expect longer, more sun-filled days in July with an average of 10.4 hours of sunshine daily, and embrace the darker days in December, offering only 1.5 hours of daily sunlight.
Visit our detailed sunshine hours page for more information.
Monthly hours of sunshine
Daily hours of sunshine
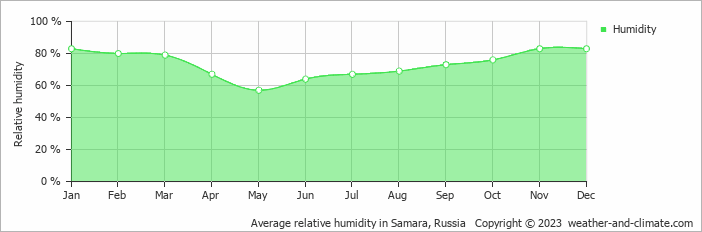
Humidity in Samara by Month
The relative humidity is high throughout the year in Samara.
The city experiences its highest humidity in January, reaching 83%. In May, the humidity drops to its lowest level at 57%. What does this mean? Read our detailed page on humidity levels for further details.
Relative humidity over the year
Best Time to Visit Samara
Frequently asked questions about the climate in Samara
What is the best time to visit Samara?
May, June, July, August and September typically offer the most optimal weather in Samara. In contrast, January, February, March, November and December tend to have less optimal conditions. Samara has a distinct dry season from February to March.
What temperatures can I expect in Samara?
Daytime highs range from -6°C (21°F) in February to 28°C (82°F) in July. Nighttime lows range from -14°C (7°F) to 16°C (61°F). Temperatures vary considerably through the year.
How much rain does Samara get?
Annual rainfall is around 548 mm (22 in). June is the wettest month with 56 mm (2.2 in), while March is the driest with 39 mm (1.5 in).
How sunny is Samara?
Samara receives around 2,124 hours of sunshine per year. July is the sunniest month with 311 hours, while December is the cloudiest with just 46 hours. Overall, Samara enjoys abundant sunshine.
Samara 3-Day Forecast
Samara 3-Day Forecast
Samara on the map
Samara is highlighted — select any city to see its climate.
Popular this month
Where to go in July — average daytime high across popular destinations.
Bucket list
Need travel inspiration? Check out our bucket list articles and be inspired.
 Visit the Kamchatka Peninsula
One of the most enchanting areas of Russia is the Kamchatka peninsula. It is how the earth must have looked like in prehistoric times.
Be amazed by the Altai mountains
The Atlai mountains are a sparsely populated area that most tourists have not yet discovered. Definitely bucket list material for the adventurous travelers among us.