Salina Cruz Weather & Climate: Best Time to Visit
Average temperatures, rainfall, sunshine and the best time to visit Salina Cruz.
Climate overview of Salina Cruz
Salina Cruz, Oaxaca, Mexico, has a stable climate with little temperature variation across the year. Average daytime temperatures hover around 32°C (90°F), peaking in May at 34°C (93°F) and dipping in January to 30°C (86°F).
The city receives considerable rainfall, with around 1000 mm (39 in) annually. June is the wettest month. It has a distinct dry season from November to April. March is the sunniest month, averaging 9.4 hours of sunshine per day.
Salina Cruz Weather by Month
Pick a month to see the average temperature, rainfall and sunshine in Salina Cruz — and find the best time to visit.
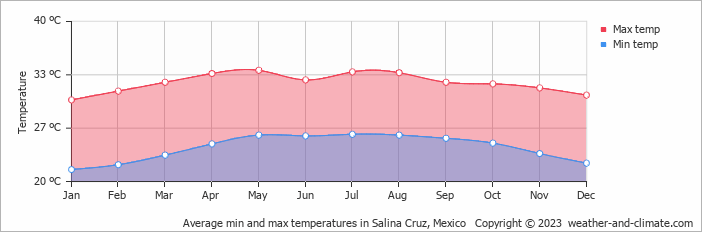
Monthly Temperature in Salina Cruz
With minimal seasonal shifts, Salina Cruz experiences a constant climate year-round. Typically, average maximum daytime temperatures range from a very warm 34°C (93°F) in May to a very warm 30°C (86°F) in the coolest month, January.
Nights vary from 26°C (79°F) in May to around 22°C (72°F) during the colder months.
Check out our detailed temperature page for more information.
Temperature ranges by month
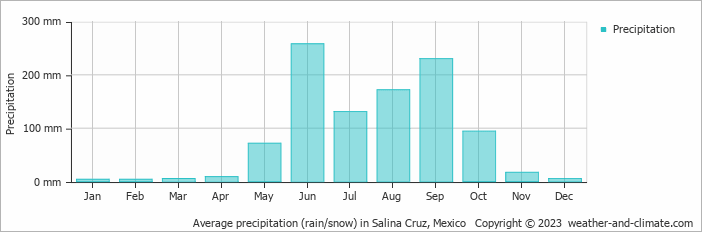
Rainfall in Salina Cruz
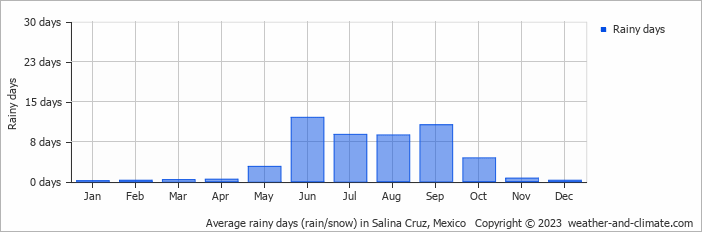
Salina Cruz has a notably wet climate with abundant precipitation, recording 1000 mm (39 in) of rainfall per year. The climate in Salina Cruz shows significant variation throughout the year. Expect heavy rainfall in June, the wettest month, with an average of 258 mm (10 in) of precipitation over 12 rainy days.
In contrast, the driest month January offers drier and sunnier days, with around 3.9 mm (0.2 in) of rainfall over 0 rainy days. For more details, please visit our Salina Cruz Precipitation page.
The mean monthly precipitation over the year, including rain, hail, and snow
The average number of days each month with precipitation
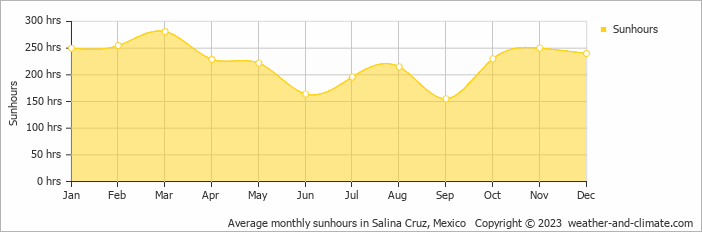
Sunshine Hours in Salina Cruz
For those who appreciate different seasons, Salina Cruz serves as an ideal destination. Expect longer, more sun-filled days in March with an average of 9.4 hours of sunshine daily, and embrace the darker days in September, offering only 5.2 hours of daily sunlight.
Visit our detailed sunshine hours page for more information.
Monthly hours of sunshine
Daily hours of sunshine
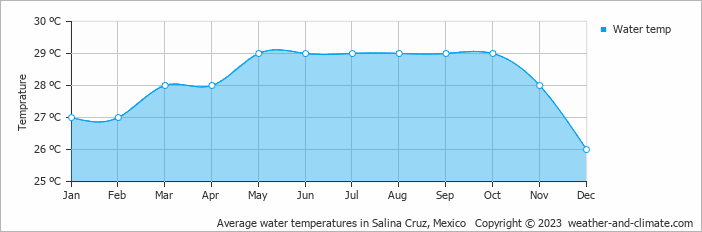
Water Temperature in Salina Cruz
The mean water temperature over the year ranges from 26°C (79°F) in December to 29°C (84°F) in May.
Water temperature over the year
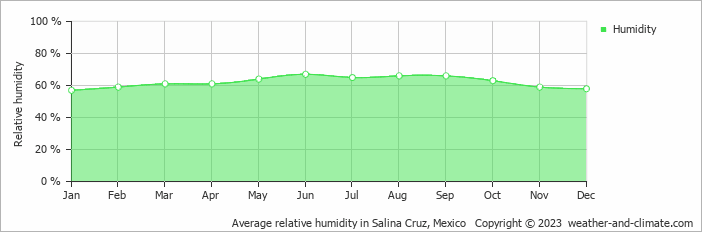
Humidity in Salina Cruz by Month
The relative humidity is high throughout the year in Salina Cruz.
The city experiences its highest humidity in June, reaching 67%. In January, the humidity drops to its lowest level at 57%. What does this mean? Read our detailed page on humidity levels for further details.
Relative humidity over the year
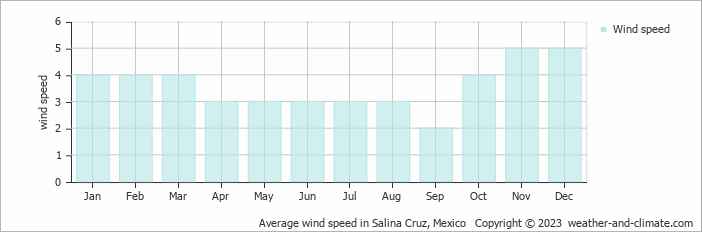
Wind Speed in Salina Cruz
The mean wind speed over the year ranges from 2 m/s (4 knots) in September to 5 m/s (10 knots) in November and December. What does this mean?
The mean monthly wind speed over the year (meters per second)
Best Time to Visit Salina Cruz
It's smart to plan your activities during the cooler morning hours or take advantage of the refreshing evenings.
Note that June, August and September make up the rainy season, with heavier precipitation expected. Ready to plan your travels but need destination ideas? Our smart tool recommends places based on the climate conditions you prefer. Start planning with our destination weather tool.
Frequently asked questions about the climate in Salina Cruz
What is the best time to visit Salina Cruz?
January, February, March, November and December typically offer the most optimal weather in Salina Cruz. In contrast, April, May, June, July, August and September tend to have less optimal conditions. Salina Cruz has a distinct dry season from November to April.
What temperatures can I expect in Salina Cruz?
Daytime highs range from 30°C (86°F) in January to 34°C (93°F) in May. Nighttime lows range from 22°C (72°F) to 26°C (79°F). Temperatures stay relatively stable year-round.
How much rain does Salina Cruz get?
Annual rainfall is around 1000 mm (39 in). June is the wettest month with 258 mm (10 in), while January is the driest with 3.9 mm (0.2 in).
How sunny is Salina Cruz?
Salina Cruz receives around 2,687 hours of sunshine per year. March is the sunniest month with 281 hours, while September is the cloudiest with just 155 hours. Overall, Salina Cruz enjoys abundant sunshine.
Salina Cruz 3-Day Forecast
Salina Cruz 3-Day Forecast
Salina Cruz on the map
Salina Cruz is highlighted — select any city to see its climate.
Popular this month
Where to go in July — average daytime high across popular destinations.
Bucket list
Need travel inspiration? Check out our bucket list articles and be inspired.
 Explore the Majestic Copper Canyons of Mexico
Explore the vast Copper Canyons in Chihuahua, Mexico—larger than the Grand Canyon. Discover scenic train rides, hikes, and the Tarahumara people.
These are the most beautiful Mayan ruins and Mayan temples in Mexico
Mexico is a destination where you can immerse yourself in ancient cultures and civilizations. In this article we have listed our favorite Mayan ruins.
Tips, to-do's and nicest restaurants in Mexico City
Mexico City, one of the most famous and notorious cities of the world. The best time to visit is between March and May, but it can be visited year round.
Zihuatanejo: A Pacific paradise with beautiful beaches
Zihuatanejo has some of Mexico's top beaches. Unlike other off-the-beaten-path destinations in Mexico, Zihua is very accessible and sustainable.