Wajima Weather & Climate: Best Time to Visit
Average temperatures, rainfall, sunshine and the best time to visit Wajima.
Climate overview of Wajima
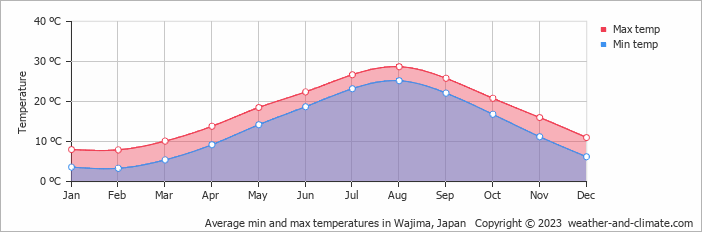
Wajima, Ishikawa, Japan, experiences significant temperature variation throughout the year. Summers bring daytime highs of 29°C (84°F) in August, while winters cool to 8°C (46°F) in February.
Rainfall is high, totalling around 1944 mm (77 in) per year. July is the wettest month and May the driest. May is the sunniest month, averaging 7.0 hours of sunshine per day.
Wajima Weather by Month
Pick a month to see the average temperature, rainfall and sunshine in Wajima — and find the best time to visit.
Monthly Temperature in Wajima
Depending on the time of the year, temperatures range from comfortable to chilly in Wajima. Average maximum daytime temperatures range from a comfortable 29°C (84°F) in August, the warmest time of the year, to a chilly 8°C (46°F) during cooler months like February.
At night, you can expect temperatures ranging from 25°C (77°F) in August to around 3°C (37°F) during February.
Check out our detailed temperature page for more information.
Temperature ranges by month
Rainfall in Wajima
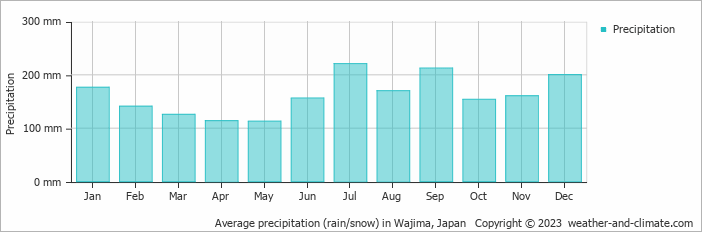
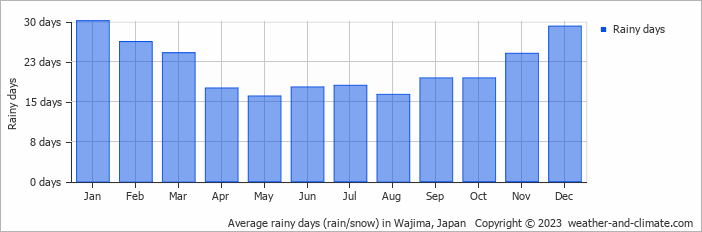
Wajima has a relatively rainy climate with high precipitation levels, averaging 1944 mm (77 in) of rainfall annually. While rainfall varies throughout the year, each season offers its own charm. July brings wetter days averaging 221 mm (8.7 in) of precipitation, spread over 18 rainy days.
In contrast, the driest month May experiences a drier climate, with about 113 mm (4.4 in) of rainfall spread across 16 rainy days. For more details, please visit our Wajima Precipitation page.
The mean monthly precipitation over the year, including rain, hail, and snow
The average number of days each month with precipitation
Sunshine Hours in Wajima
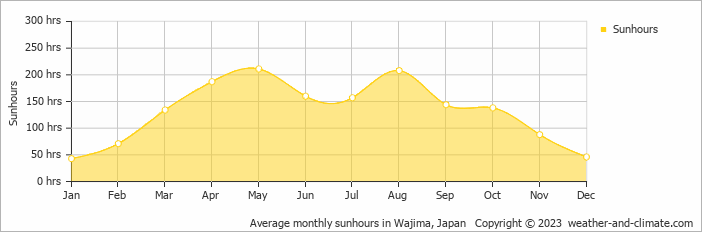
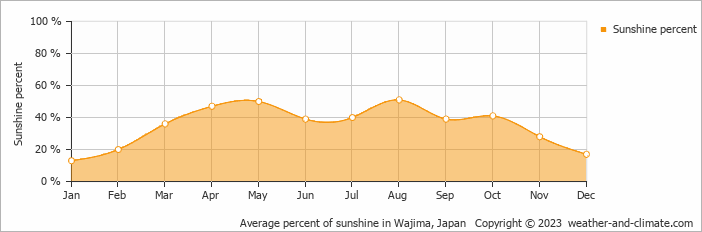
Seasonal changes in sunshine hours are quite dramatic in Wajima. While May receives considerable daily sunshine with up to 7.0 hours, January marks the darkest time of the year, where sunshine is scarce with only 1.4 hours of sunlight per day.
Visit our detailed sunshine hours page for more information.
Monthly hours of sunshine
Daily hours of sunshine
Daily percentage of sunshine
Water Temperature in Wajima
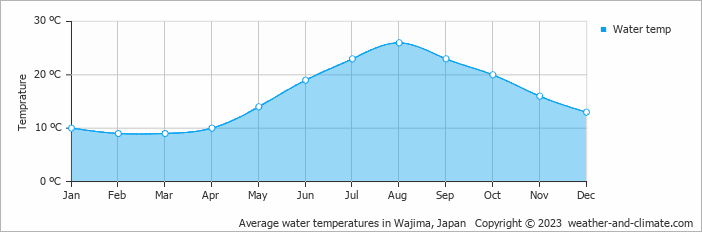
The mean water temperature over the year ranges from 9°C (48°F) in February to 26°C (79°F) in August.
Water temperature over the year
Humidity in Wajima by Month
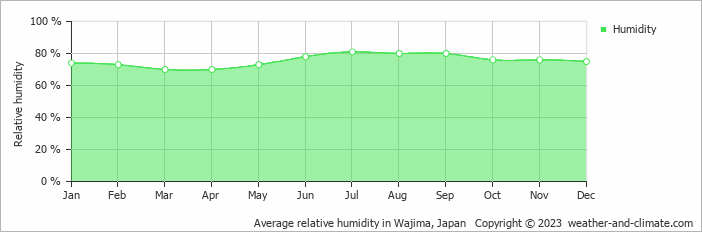
The relative humidity is high throughout the year in Wajima.
The city experiences its highest humidity in July, reaching 81%. In March, the humidity drops to its lowest level at 70%. What does this mean? Read our detailed page on humidity levels for further details.
Relative humidity over the year
Wind Speed in Wajima
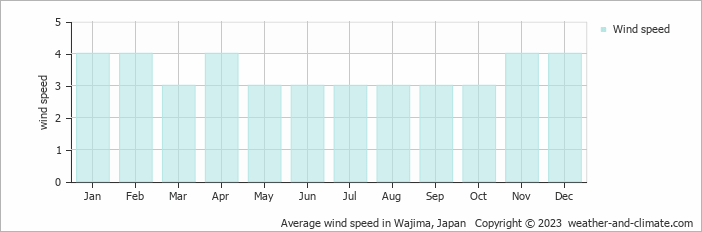
The mean wind speed varies between 3 m/s (6 knots) and 4 m/s (8 knots) throughout the year. It is lowest in March, May, June, July, August, September and October and highest during January, February, April, November and December. What does this mean?
The mean monthly wind speed over the year (meters per second)
Best Time to Visit Wajima
Rainfall during this time ranges from 113 mm (4.4 in) in May to 156 mm (6.1 in) in June. This means you can expect a mix of sunny days and occasional showers.
The rainy season falls during January, July, August, September, November and December, bringing heavy precipitation. Looking for inspiration on where to travel this year? We have a tool that recommends destinations based on your ideal conditions. Find out where to go with our weather planner.
Frequently asked questions about the climate in Wajima
What is the best time to visit Wajima?
June, August and October typically offer the most optimal weather in Wajima. In contrast, January, February, March and December tend to have less optimal conditions.
What temperatures can I expect in Wajima?
Daytime highs range from 8°C (46°F) in February to 29°C (84°F) in August. Nighttime lows range from 3°C (37°F) to 25°C (77°F). Temperatures vary considerably through the year.
How much rain does Wajima get?
Annual rainfall is around 1944 mm (77 in). July is the wettest month with 221 mm (8.7 in), while May is the driest with 113 mm (4.4 in).
How sunny is Wajima?
Wajima receives around 1,587 hours of sunshine per year. May is the sunniest month with 211 hours, while January is the cloudiest with just 43 hours.
Wajima 3-Day Forecast
Wajima 3-Day Forecast
Wajima on the map
Wajima is highlighted — select any city to see its climate.
Popular this month
Where to go in July — average daytime high across popular destinations.
Bucket list
Need travel inspiration? Check out our bucket list articles and be inspired.
 Chase the autumn leaves in Japan
Japan is one of these cases which turns into a gold, yellow and orange fairy tale starting from September. And we can honestly say: We cannot imagine a more beautiful season to visit Japan.
Walk the 88 temple circuit
We recommend walking the 88 temple circuit from April til October. Although June, July and August can be a bit wet, hot and humid.
The famous bamboo forests of Arashiyama
The famous bamboo forests of Arashiyama lie just outside the city center of Kyoto and is unique in the world. If you look at photos of this bamboo forest, it looks like you have landed in a fairy-tale world.
10 reasons why you should visit Japan in winter
Here are 10 reasons why you should plan a winter trip to Japan. During this period, popular sights are less busy and prices for flights and hotels much cheaper.