Salto Weather & Climate: Best Time to Visit
Average temperatures, rainfall, sunshine and the best time to visit Salto.
Climate overview of Salto
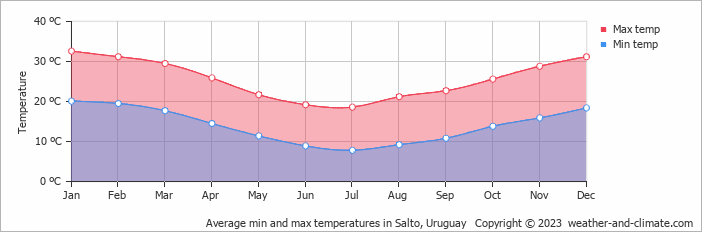
Salto, Salto, Uruguay, experiences significant temperature variation throughout the year. Summers bring daytime highs of 33°C (91°F) in January, while winters cool to 19°C (66°F) in July.
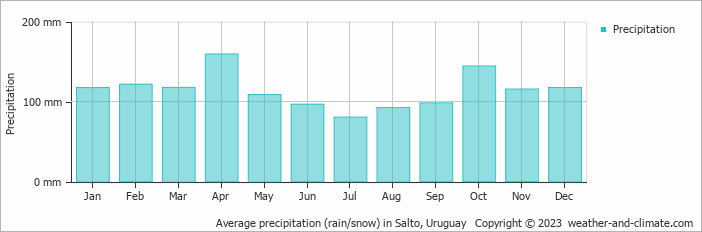
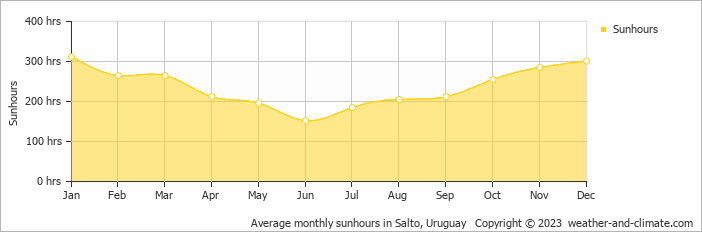
With around 1367 mm (54 in) of annual rainfall, Salto has a notably wet climate. The wettest month is April. The sunniest month is January, with 10.4 hours of sunshine per day on average.
Salto Weather by Month
Pick a month to see the average temperature, rainfall and sunshine in Salto — and find the best time to visit.
Monthly Temperature in Salto
Depending on the time of the year, temperatures range from very warm to pleasant in Salto. Average daytime temperatures reach a very warm 33°C (91°F) in January. In July, the coolest month of the year, temperatures drop to a pleasant 19°C (66°F).
At night, temperatures range from around 20°C (68°F) in January to 8°C (46°F) in July.
Check out our detailed temperature page for more information.
Temperature ranges by month
Rainfall in Salto
Salto has a relatively rainy climate with high precipitation levels, averaging 1367 mm (54 in) of rainfall annually. Salto experiences moderate seasonal variation in rainfall, with monthly averages ranging from 159 mm (6.3 in) in April, the wettest month, and 80 mm (3.1 in) in July, the driest month. For more details, please visit our Salto Precipitation page.
The mean monthly precipitation over the year, including rain, hail, and snow
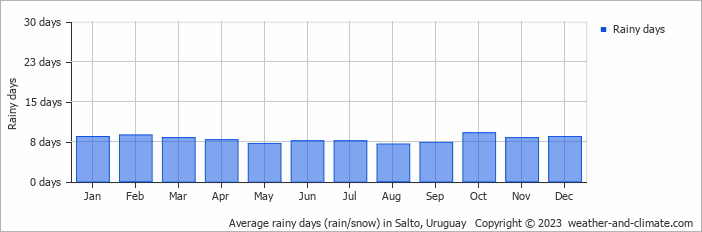
The average number of days each month with precipitation
Sunshine Hours in Salto
Salto can be enjoyed more throughout the sunniest month of January under a blue sky, with approximately 10.4 hours of sunshine daily. In contrast, the city experiences much darker days in June, with only 5.1 hours of sunlight per day.
Visit our detailed sunshine hours page for more information.
Monthly hours of sunshine
Daily hours of sunshine
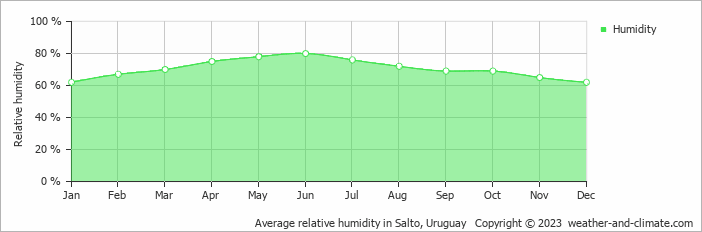
Humidity in Salto by Month
The relative humidity is high throughout the year in Salto.
The city experiences its highest humidity in June, reaching 80%. In January, the humidity drops to its lowest level at 62%. What does this mean? Read our detailed page on humidity levels for further details.
Relative humidity over the year
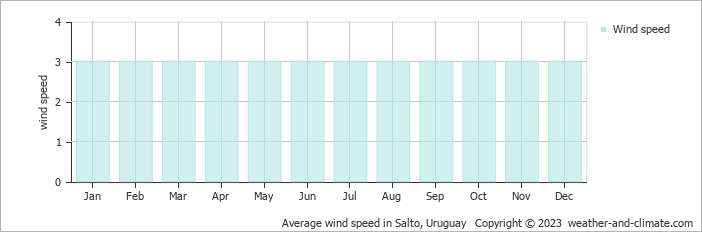
Wind Speed in Salto
The average wind speed over the year ranges from 3 m/s (6 knots) to 3 m/s (6 knots). It is lower in January, February, March, April, May, June, July, August, September, October, November and December and higher in January, February, March, April, May, June, July, August, September, October, November and December. What does this mean?
The mean monthly wind speed over the year (meters per second)
Best Time to Visit Salto
Rainfall during this time ranges from 92 mm (3.6 in) in August to 108 mm (4.3 in) in May. This means you can expect a mix of sunny days and occasional showers. Ready to plan your travels but need destination ideas? Our smart tool recommends places based on the climate conditions you prefer. Start planning with our destination weather tool.
Frequently asked questions about the climate in Salto
What is the best time to visit Salto?
August and September typically offer the most optimal weather in Salto. In contrast, January tends to have less optimal conditions.
What temperatures can I expect in Salto?
Daytime highs range from 19°C (66°F) in July to 33°C (91°F) in January. Nighttime lows range from 8°C (46°F) to 20°C (68°F). Temperatures vary considerably through the year.
How much rain does Salto get?
Annual rainfall is around 1367 mm (54 in). April is the wettest month with 159 mm (6.3 in), while July is the driest with 80 mm (3.1 in).
How sunny is Salto?
Salto receives around 2,845 hours of sunshine per year. January is the sunniest month with 312 hours, while June is the cloudiest with just 152 hours. Overall, Salto enjoys abundant sunshine.
Salto 3-Day Forecast
Salto 3-Day Forecast
Salto on the map
Salto is highlighted — select any city to see its climate.
Popular this month
Where to go in July — average daytime high across popular destinations.
Bucket list
Need travel inspiration? Check out our bucket list articles and be inspired.
 The 10 most alternative cities in South America
Discover South America's top 10 alternative cities! From Valparaíso's vibrant streets to La Paz's high-altitude charm and Medellín's innovative spirit.
 Carmelo is the best kept secret of Uruguay
With its natural beauty and history, Carmelo is an inviting place to visit. Enjoy nature, tranquility, authenticity, the 'wine' and activities such as cycling, walking and horse riding.