Rotuma Weather & Climate: Best Time to Visit
Average temperatures, rainfall, sunshine and the best time to visit Rotuma.
Climate overview of Rotuma
There is no real rainy season in Rotuma since every month sees a significant amount of rain. In the first part of the year, tropical storms and hurricanes can occur. The average humidity is on the high side with 82% throughout the year.
Rotuma Weather by Month
Pick a month to see the average temperature, rainfall and sunshine in Rotuma — and find the best time to visit.
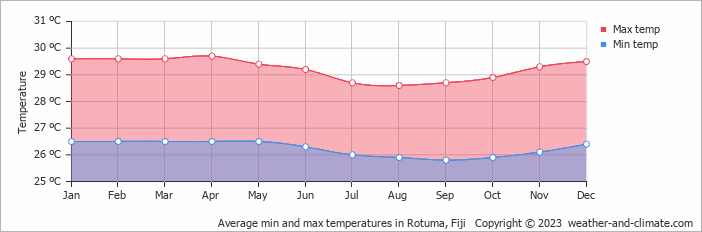
Monthly Temperature in Rotuma
The climate in Rotuma remains fairly constant, offering comfortable temperatures throughout the year. Average maximum daytime temperatures range from a comfortable 30°C (86°F) in April, the warmest time of the year, to a comfortable 29°C (84°F) during cooler months like September.
At night, you can expect temperatures ranging from 27°C (81°F) in April to around 26°C (79°F) during September.
Check out our detailed temperature page for more information.
Temperature ranges by month
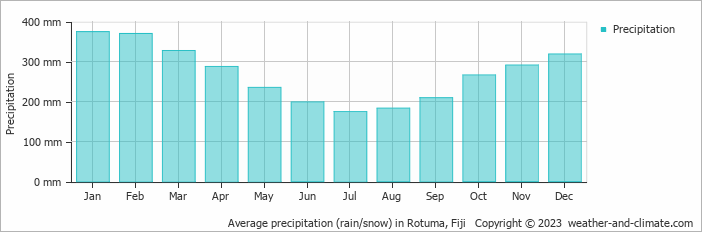
Rainfall in Rotuma
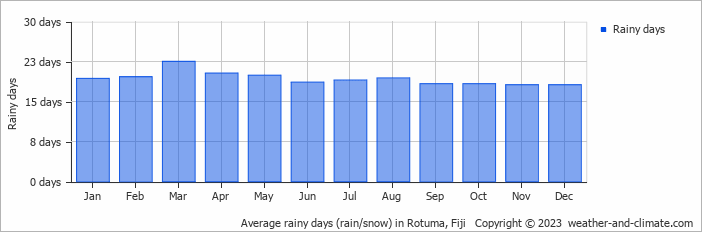
Rotuma is known for its substantial rainfall, with annual precipitation reaching 3233 mm (127 in). While rainfall varies throughout the year, each season offers its own charm. January brings wetter days averaging 374 mm (15 in) of precipitation, spread over 19 rainy days.
In contrast, the driest month July experiences a drier climate, with about 174 mm (6.9 in) of rainfall spread across 19 rainy days. For more details, please visit our Rotuma Precipitation page.
The mean monthly precipitation over the year, including rain, hail, and snow
The average number of days each month with precipitation
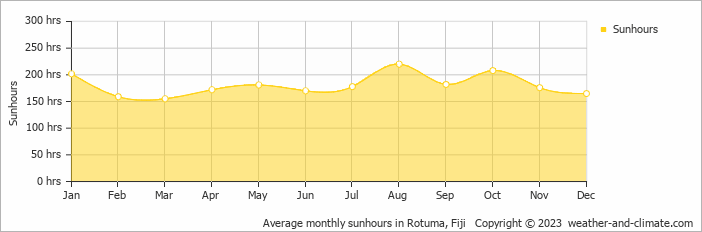
Sunshine Hours in Rotuma
While the amount of sunshine in Rotuma varies throughout the year, all seasons offer their own charm. Enjoy up to 7.3 hours of daily sun in August, and experience slightly darker atmosphere in March, with about 5.2 hours of daily sunlight.
Visit our detailed sunshine hours page for more information.
Monthly hours of sunshine
Daily hours of sunshine
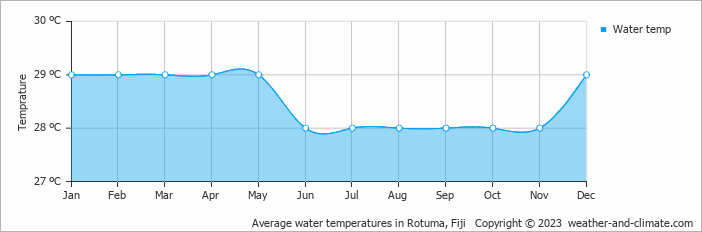
Water Temperature in Rotuma
The mean water temperature over the year ranges from 28°C (82°F) in June to 29°C (84°F) in January.
Water temperature over the year
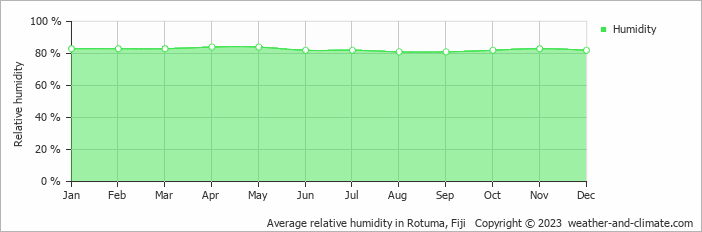
Humidity in Rotuma by Month
The city experiences its highest humidity in April, reaching 84%. In August, the humidity drops to its lowest level at 81%. What does this mean? Read our detailed page on humidity levels for further details.
Relative humidity over the year
Best Time to Visit Rotuma
Embrace the wet climate by bringing proper rain gear and plan activities that are indoor. Need help choosing your next travel destination? We offer a specialized tool that matches you with locations based on your weather preferences. Explore destinations that suit your climate preferences.
Frequently asked questions about the climate in Rotuma
What is the best time to visit Rotuma?
July typically offers the most optimal weather in Rotuma. In contrast, January, February, March, April, October, November and December tend to have less optimal conditions.
What temperatures can I expect in Rotuma?
Daytime highs range from 29°C (84°F) in September to 30°C (86°F) in April. Nighttime lows range from 26°C (79°F) to 27°C (81°F). Temperatures stay relatively stable year-round.
How much rain does Rotuma get?
Annual rainfall is around 3233 mm (127 in). January is the wettest month with 374 mm (15 in), while July is the driest with 174 mm (6.9 in).
How sunny is Rotuma?
Rotuma receives around 2,168 hours of sunshine per year. August is the sunniest month with 220 hours, while March is the cloudiest with just 155 hours. Overall, Rotuma enjoys abundant sunshine.
Rotuma 3-Day Forecast
Rotuma 3-Day Forecast
Rotuma on the map
Rotuma is highlighted — select any city to see its climate.
Popular this month
Where to go in July — average daytime high across popular destinations.
Bucket list
Need travel inspiration? Check out our bucket list articles and be inspired.
