La Orchila Weather & Climate: Best Time to Visit
Average temperatures, rainfall, sunshine and the best time to visit La Orchila.
Climate overview of La Orchila
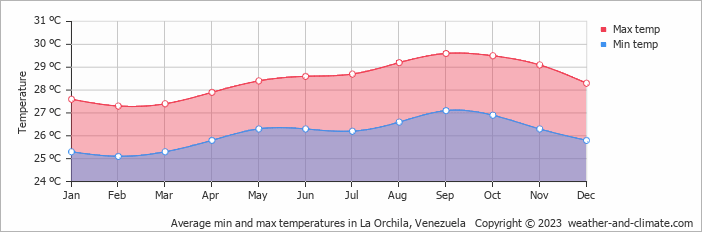
La Orchila, Venezuela, has a stable climate with little temperature variation across the year. Average daytime temperatures hover around 28°C (82°F), peaking in September at 30°C (86°F) and dipping in February to 27°C (81°F).
The city receives around 716 mm (28 in) of rainfall per year. It experiences a distinct dry season from February to May. November is the wettest month and March the driest.
La Orchila Weather by Month
Pick a month to see the average temperature, rainfall and sunshine in La Orchila — and find the best time to visit.
Monthly Temperature in La Orchila
With minimal seasonal shifts, La Orchila experiences a constant climate year-round. On average, daytime temperatures range from a comfortable 30°C (86°F) in September to a comfortable 27°C (81°F) in February.
Nighttime temperatures range from 27°C (81°F) in September to 25°C (77°F) in February.
Check out our detailed temperature page for more information.
Temperature ranges by month
Rainfall in La Orchila
Generally, La Orchila receives mid-range precipitation levels, with 716 mm (28 in) annually. The seasons in La Orchila bring significant changes in precipitation. The wettest month, November, receives high rainfall, with an average of 123 mm (4.8 in) of precipitation. This rainfall is distributed across 14 rainy days.
In contrast, the driest month, March, experiences much less rainfall, totaling 20 mm (0.8 in) over 6 rainy days. These distinct seasonal differences provide diverse experiences throughout the year. For more details, please visit our La Orchila Precipitation page.
The mean monthly precipitation over the year, including rain, hail, and snow

The average number of days each month with precipitation

Water Temperature in La Orchila
The mean water temperature over the year ranges from 27°C (81°F) in January to 28°C (82°F) in May.
Water temperature over the year

Best Time to Visit La Orchila
The varied rainfall (from 20 mm (0.8 in) to 123 mm (4.8 in)) creates diverse landscapes throughout the year. For the best outdoor conditions, plan your visit during the drier months like March. Need help choosing your next travel destination? We offer a specialized tool that matches you with locations based on your weather preferences. Explore destinations that suit your climate preferences.
Frequently asked questions about the climate in La Orchila
What is the best time to visit La Orchila?
January, February, March, April, May, June, July, August and December typically offer the most optimal weather in La Orchila. In contrast, September and October tend to have less optimal conditions. La Orchila has a distinct dry season from February to May.
What temperatures can I expect in La Orchila?
Daytime highs range from 27°C (81°F) in February to 30°C (86°F) in September. Nighttime lows range from 25°C (77°F) to 27°C (81°F). Temperatures stay relatively stable year-round.
How much rain does La Orchila get?
Annual rainfall is around 716 mm (28 in). November is the wettest month with 123 mm (4.8 in), while March is the driest with 20 mm (0.8 in).
La Orchila 3-Day Forecast
La Orchila 3-Day Forecast
La Orchila on the map
La Orchila is highlighted — select any city to see its climate.
Popular this month
Where to go in July — average daytime high across popular destinations.
 Coro
Coro 34°C (93°F) Cuidad Bolivar
 32°C (90°F) Guanare31°C (88°F) Caracas
 30°C (86°F) Guasdualito30°C (86°F) Isla De Aves
 29°C (84°F) Caraballeda
 29°C (84°F) Barquisimeto30°C (86°F)


Bucket list
Need travel inspiration? Check out our bucket list articles and be inspired.
Visit Angel Falls
There are many Waterfalls in South Amerika to visit, however The Angel Falls is a waterfall like no other. This world heritage park needs to undoubtedly be on your bucket list.
Go to Merida in Venezuela
Mérida is a laidback backpacker city and is full of students. The university city is the cultural center of the Andes and with a special location at 1700 meters a must for every traveler.
 Mount Roraima is one of the most spectacular treks in Latin America
Mount Roraima, the feeling is indescribable. This is where the world seems to stop. As if you are on the roof of the world. Something you need to add to the bucket list.