Carnarvon Weather & Climate: Best Time to Visit
Average temperatures, rainfall, sunshine and the best time to visit Carnarvon.
Climate overview of Carnarvon
Carnarvon, Australian Capital Territory, Australia, has a moderate seasonal temperature range, with February reaching 33°C (91°F) and July cooling to 23°C (73°F).
Rainfall is extremely rare, with only 196 mm (7.7 in) falling across the entire year.
Carnarvon Weather by Month
Pick a month to see the average temperature, rainfall and sunshine in Carnarvon — and find the best time to visit.
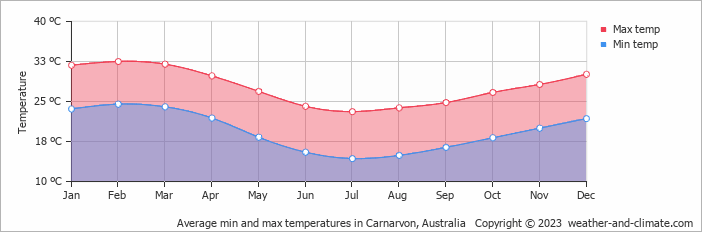
Monthly Temperature in Carnarvon
The weather in Carnarvon changes moderately throughout the year, offering enough variation to appreciate each season. Average maximum daytime temperatures range from a very warm 33°C (91°F) in February, the warmest time of the year, to a comfortable 23°C (73°F) during cooler months like July.
At night, you can expect temperatures ranging from 25°C (77°F) in February to around 14°C (57°F) during July.
Check out our detailed temperature page for more information.
Temperature ranges by month
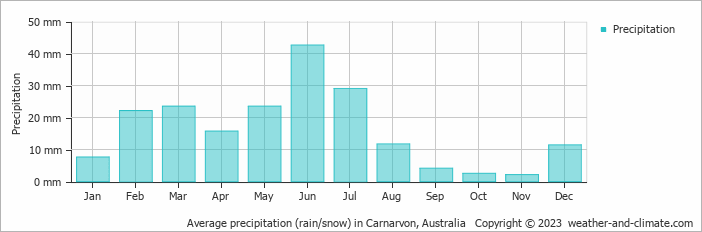
Rainfall in Carnarvon
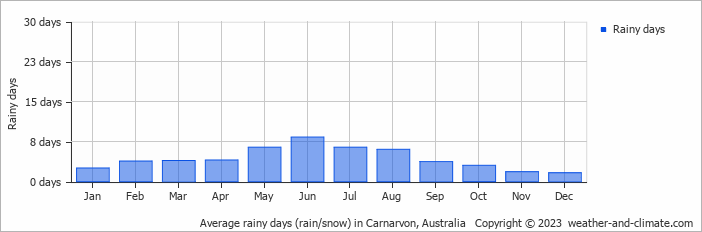
Carnarvon experiences desert-like conditions in terms of precipitation with almost no rainfall, generally receiving 196 mm (7.7 in) annually. Significant seasonal changes in precipitation occur throughout the year. In the wettest month, June it receives moderate rainfall, averaging 43 mm (1.7 in) of precipitation, recorded across 8 rainy days. In contrast, the driest month November brings less rainfall, with 2.1 mm (0.1 in) over 2 rainy days. For more details, please visit our Carnarvon Precipitation page.
The mean monthly precipitation over the year, including rain, hail, and snow
The average number of days each month with precipitation
Water Temperature in Carnarvon
The mean water temperature over the year ranges from 20°C (68°F) in September to 24°C (75°F) in January.
Water temperature over the year

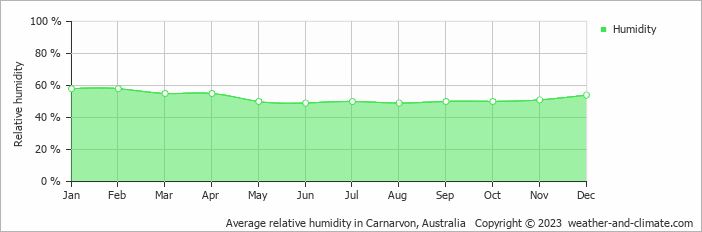
Humidity in Carnarvon by Month
The relative humidity is moderate throughout the year in Carnarvon.
The city experiences its highest humidity in January, reaching 58%. In June, the humidity drops to its lowest level at 49%. What does this mean? Read our detailed page on humidity levels for further details.
Relative humidity over the year
Best Time to Visit Carnarvon
Make the most of the clear weather, but remember to protect yourself from the sun and stay well-hydrated. Looking for inspiration on where to travel this year? We have a tool that recommends destinations based on your ideal conditions. Find out where to go with our weather planner.
Frequently asked questions about the climate in Carnarvon
What is the best time to visit Carnarvon?
May, June, July, August, September, October and November typically offer the most optimal weather in Carnarvon. In contrast, February tends to have less optimal conditions. Carnarvon has a distinct dry season from July to May.
What temperatures can I expect in Carnarvon?
Daytime highs range from 23°C (73°F) in July to 33°C (91°F) in February. Nighttime lows range from 14°C (57°F) to 25°C (77°F).
How much rain does Carnarvon get?
Annual rainfall is around 196 mm (7.7 in). June is the wettest month with 43 mm (1.7 in), while November is the driest with 2.1 mm (0.1 in).
Carnarvon 3-Day Forecast
Carnarvon 3-Day Forecast
Carnarvon on the map
Carnarvon is highlighted — select any city to see its climate.
Popular this month
Where to go in July — average daytime high across popular destinations.
Bucket list
Need travel inspiration? Check out our bucket list articles and be inspired.
 An alternative way to discover Sydney
We have made an overview of the sights in Sydney that you must see if you want to visit Sydney in an alternative way.
The most relaxed and alternative area of Australia is called the Byron Shire
The Byron Shire is one of the most pretty areas in the world. Not only in terms on natural beauty, also the relaxed vibe and people make this an area that remains close to your heart.
Sail the Whitsunday islands
The best travel period to sail the Whitsunday islands is “winter” between June and October, with pleasant temperatures around 23 degrees Celsius (74 Fahrenheit).
The best dive spots in Australia
Explore Australia's best dive spots: from the Great Barrier Reef to HMAS Perth. Discover vibrant corals, marine life, and historic wrecks.